

Let’s continue with the tenets of Dow Theory:
2.Classification of Trends.
Trends are broadly classified into three major groups: The Primary wave, The Secondary swings & the minor day-to-day fluctuations. Let’s consider each of them in bit more details.
- The Primary wave is the grand scale of large price movements in any direction, up or down, sometimes continuing for years. It is the basic bullish & bearish cycle that mirrors the progress of an economy.
- The Primary waves are paused intermittently by secondary swings. Positional traders try to capture these secondary swings to earn profit. There are various technical & statistical approaches that attempt to take advantages of this volatility; we shall discuss a few of them in due course of time.
- Short term trends are meaningless day-to-day fluctuations, having no special significance to positional traders or investors. They are caused mainly by irrational human emotions.
According to Dow, the short term trends are the only ones that can be manipulated to some extent. The other bigger trends are driven mainly by economic imbalance of supply & demand and also by liquidity and can never be manipulated.
Pictures are worth thousands of words. So some examples of trends classified as above are given below. But before that, some readers might become curious to learn how human emotions could drive prices. There is a branch of technical analysis, called Behavioral Finance that explains how people take decisions under stress, and why these decisions are mostly incorrect. We shall later come back to this topic and see how greed, fear, desperation could drive prices in short term extremes. But for the time being, let us go back to Dow and examine a few examples of trends in various time frames.
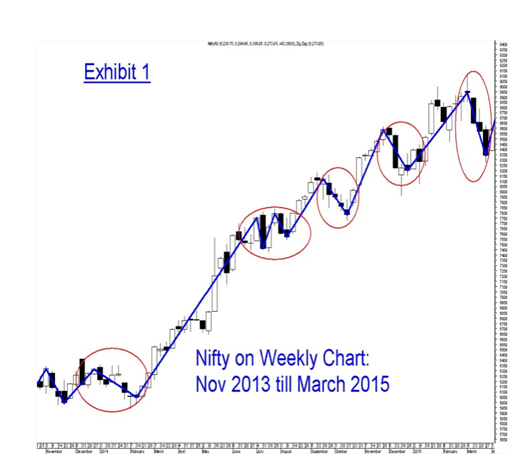
Exhibit 1
15 Months of price action in Nifty shown from Nov 2013 till Mar 2015
Observations & Inferences:
- The Zigzag function (Line shown in blue) shows Higher Top & Higher Bottom Formation: So it is a Primary Uptrend
- The Primary uptrend is occasionally interrupted by secondary corrections (Shown in Red ellipses). These might be buying opportunities on weakness.
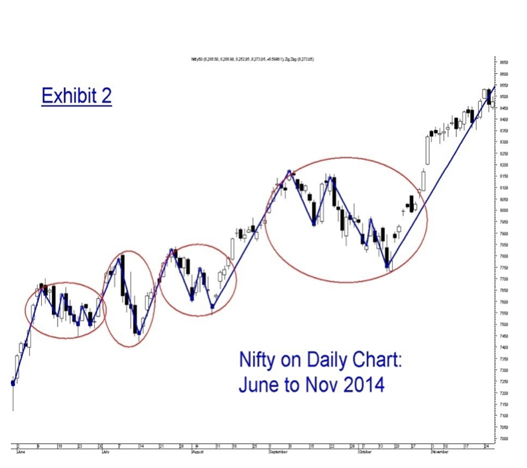
Exhibit 2
Daily Chart of Nifty for 6 months from Jun to Nov 2014
Observations & Inferences
- This is the period when Primary Trend was bullish (Refer to Exhibit 1)
- This is a daily chart. Hence the red circles reveal more details of secondary corrections.
- We can see that the intermittent corrective phases are also composed of lower tops & lower bottoms. These details were not visible in the weekly chart of Exhibit 1.
(Trading Idea: When the Primary trend is up & Secondary trend is down, lets watch the series of lower tops in smaller time frame. e.g. daily chart as used here in this example. When the series of lower tops in smaller time frame are exhausted, odds are high that the corrective phase is over & primary uptrend is likely to resume.)
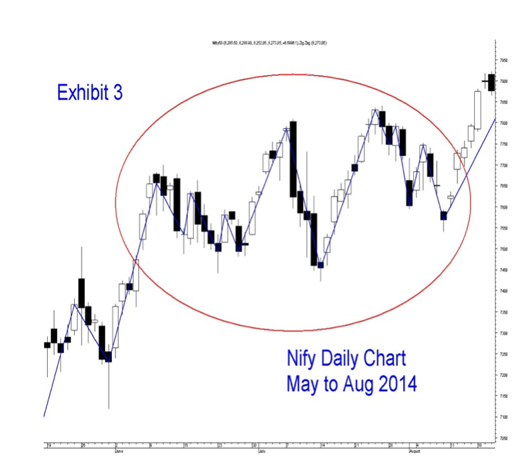
Exhibit 3
4 Months of Daily Price Action is shown in Nifty from May to Aug 2014
Observation & Inferences
Although it is known that bigger time frame trend is bullish, yet there is less order & prices are mostly chaotic in extreme short term. This is precisely why day to day fluctuations should be overlooked and one should stay in tune with the primary trend.
We will discuss the remaining four tenets in the coming week…


